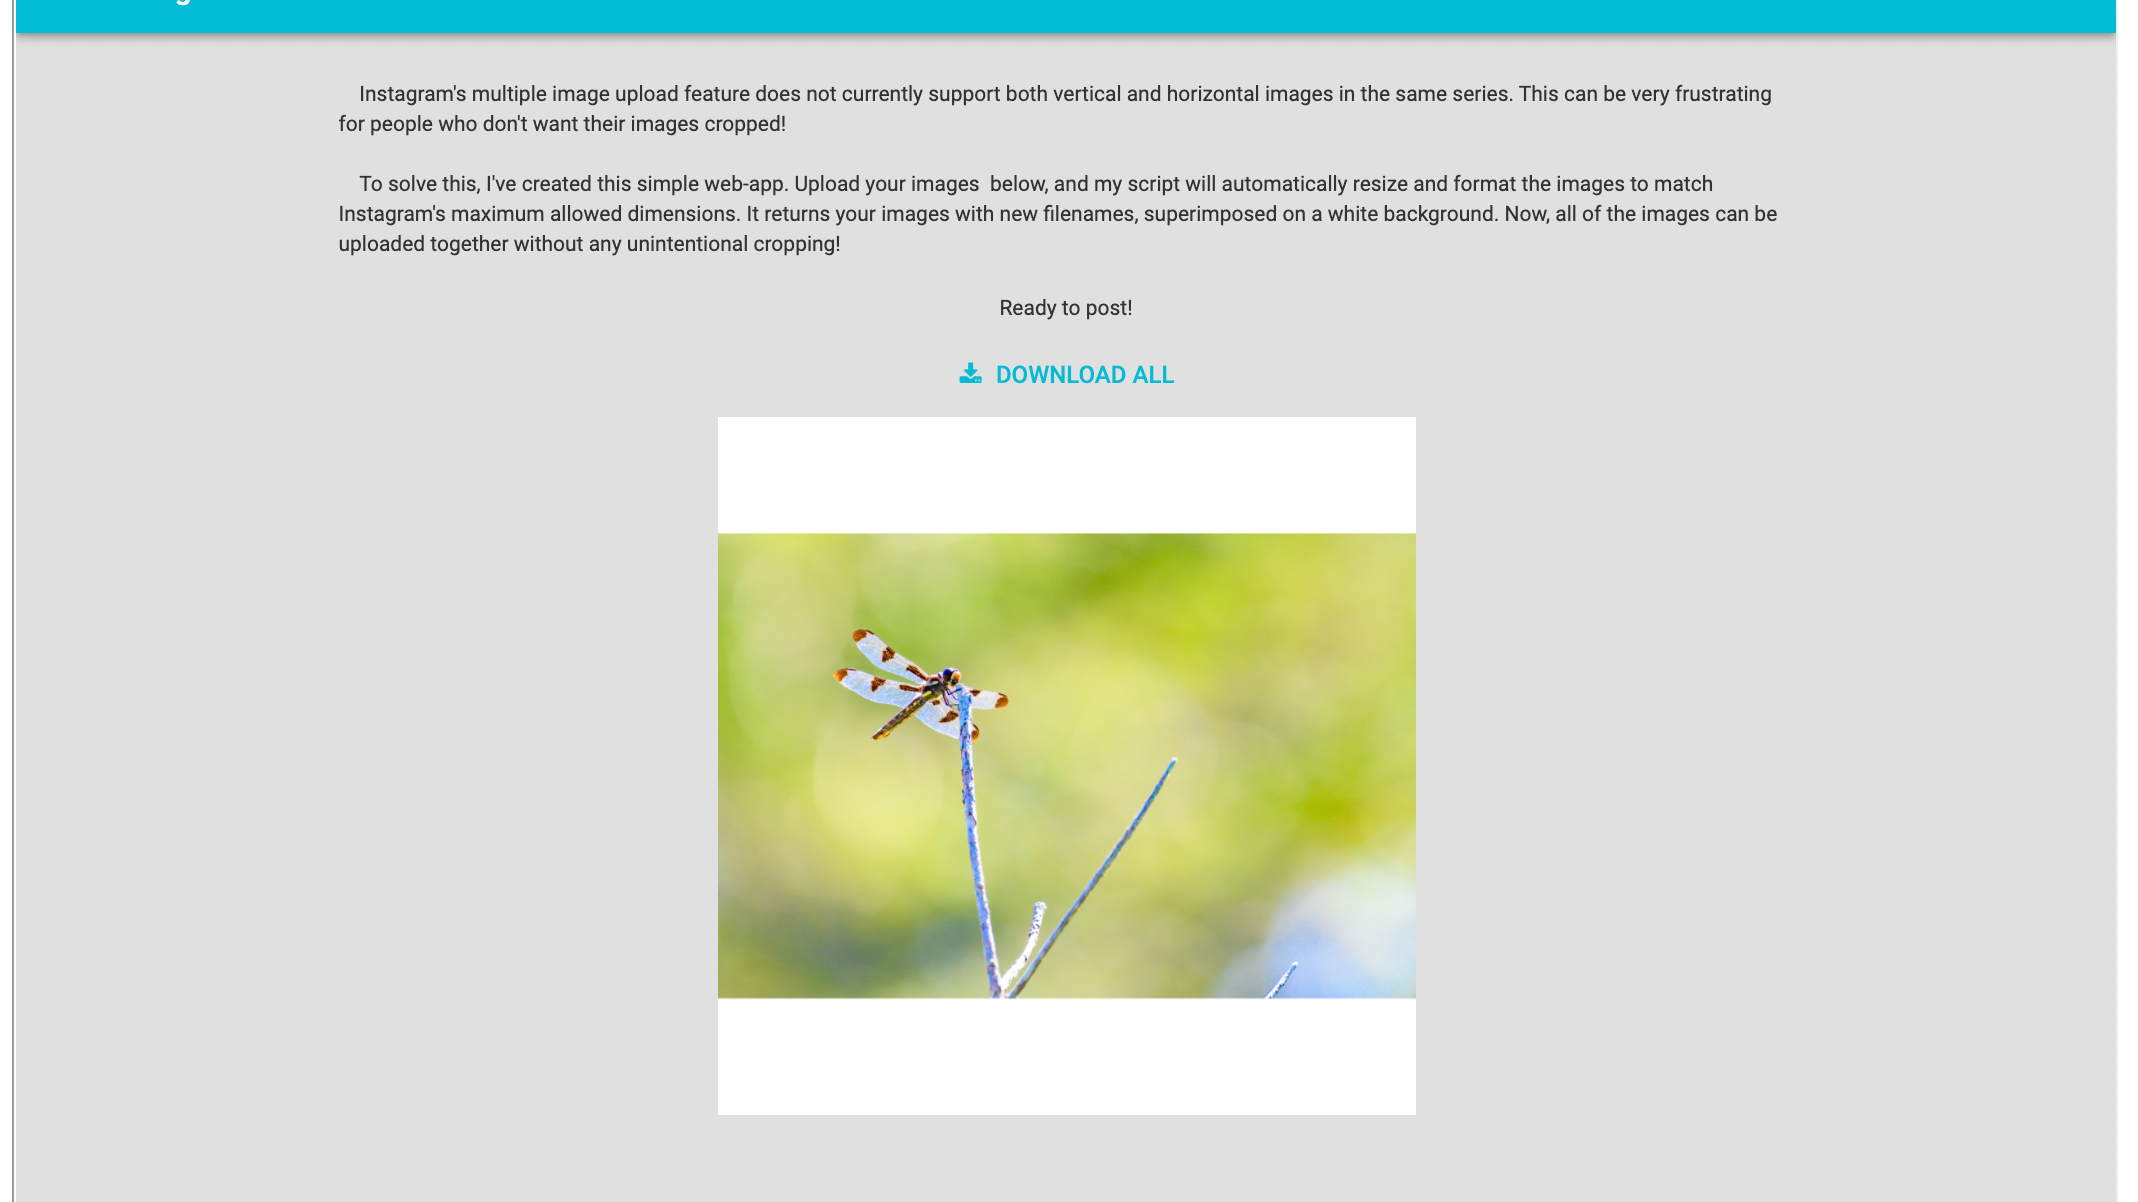
Screen shot of the user interface with sample data
The system has two main components: a google form for data entry, and a google sheets document for data visualization and manipulation
The google form gathers information from the user about the cost and nature of each transaction. The form is linked to the sheets document, so the information is automatically added into the dataset. The form can be easily accessed with an internet connection. I have the form linked to my smartphone's homescreen for easy access.
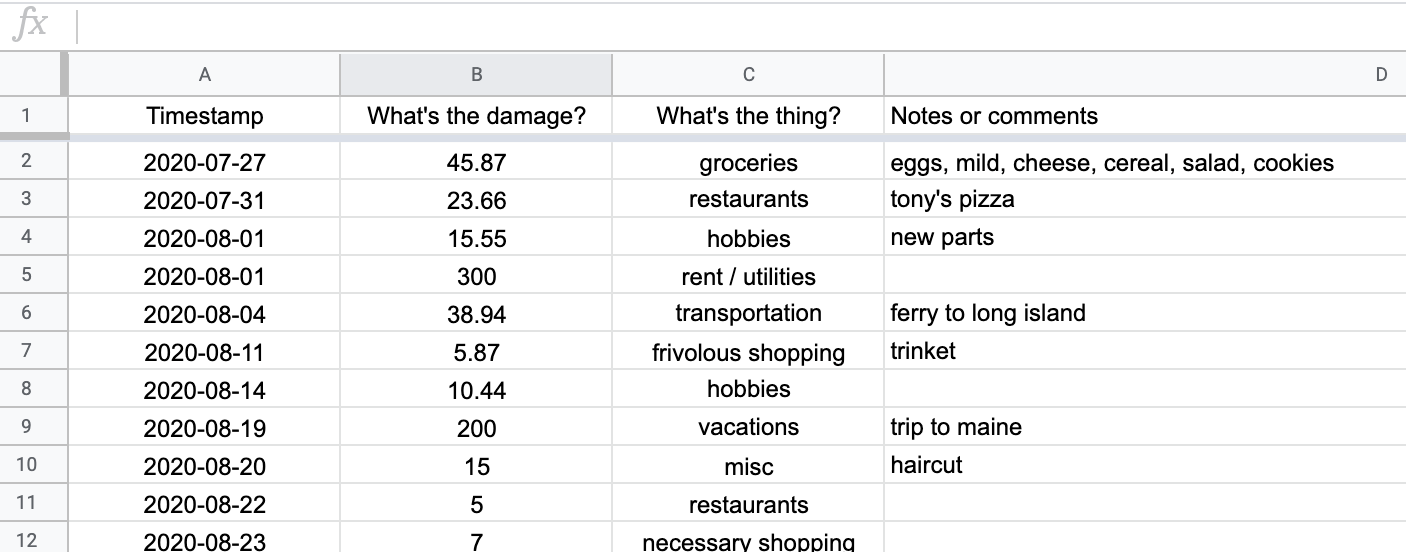
From the form, the entry is time stamped and added to the list of transactions. The user can see this list of transactions, and directly edit the data if there are any errors or mistakes. This list also serves as the input data for the visualization charts.
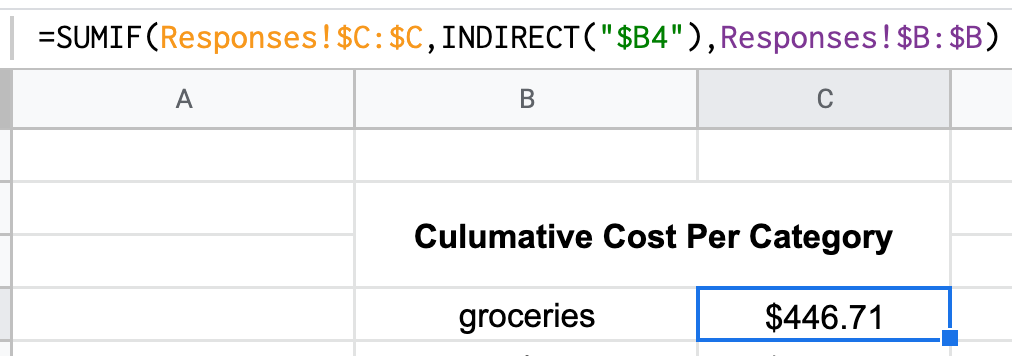
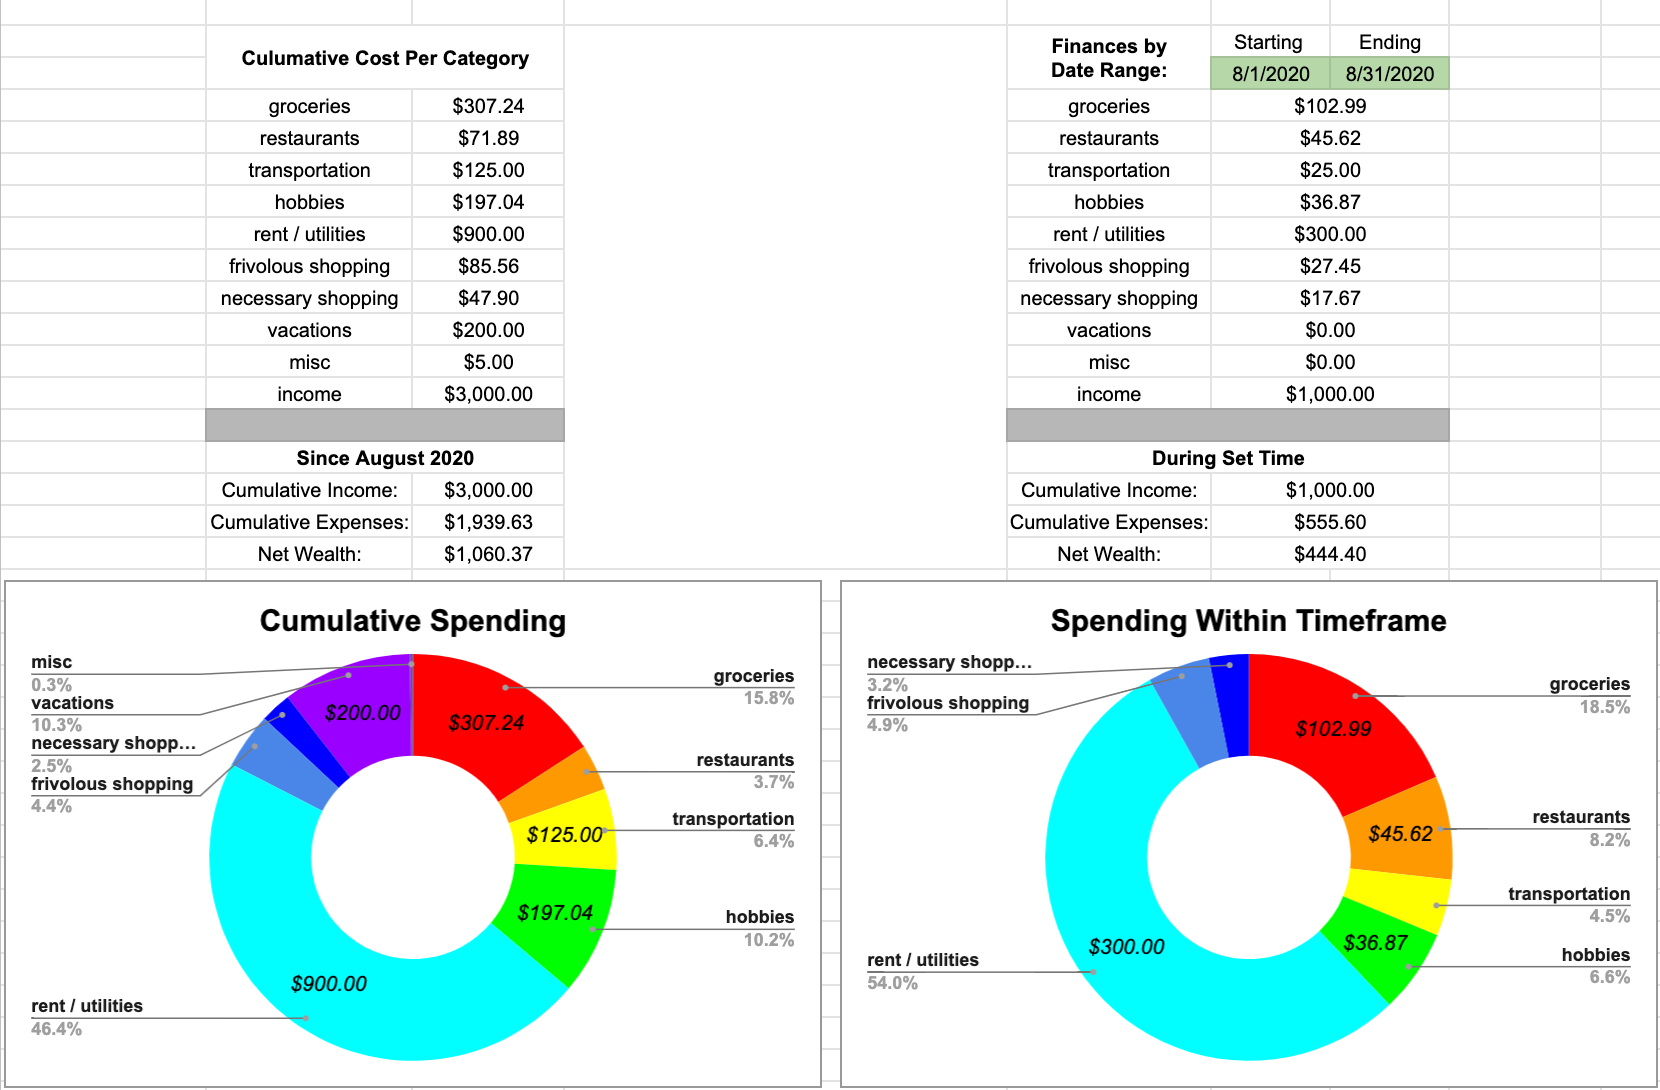
Using the string of transactions, a simple cell of code can produce a cumulative total for each spending category.
The formula on the top reads through each line in the transaction list, and sums only the values associated with the 'groceries' category. This yields the total amount of money spent on groceries by the user, since they started using the system.
You can also view the amount of money spent in each category during select timeframes. This is especially useful if you would like to track your monthly spending, or see which times of the year you spend more or less money. This slightly more complex code cell allows the further filtering of transaction data.

The last step in using this system is to make sure that you are consistent in your reporting. Unlike other budget tracking software, this has no interface with personal banking accounts. Each transaction must be reported by the individual, otherwise the presented data will be incomplete and inaccurate.