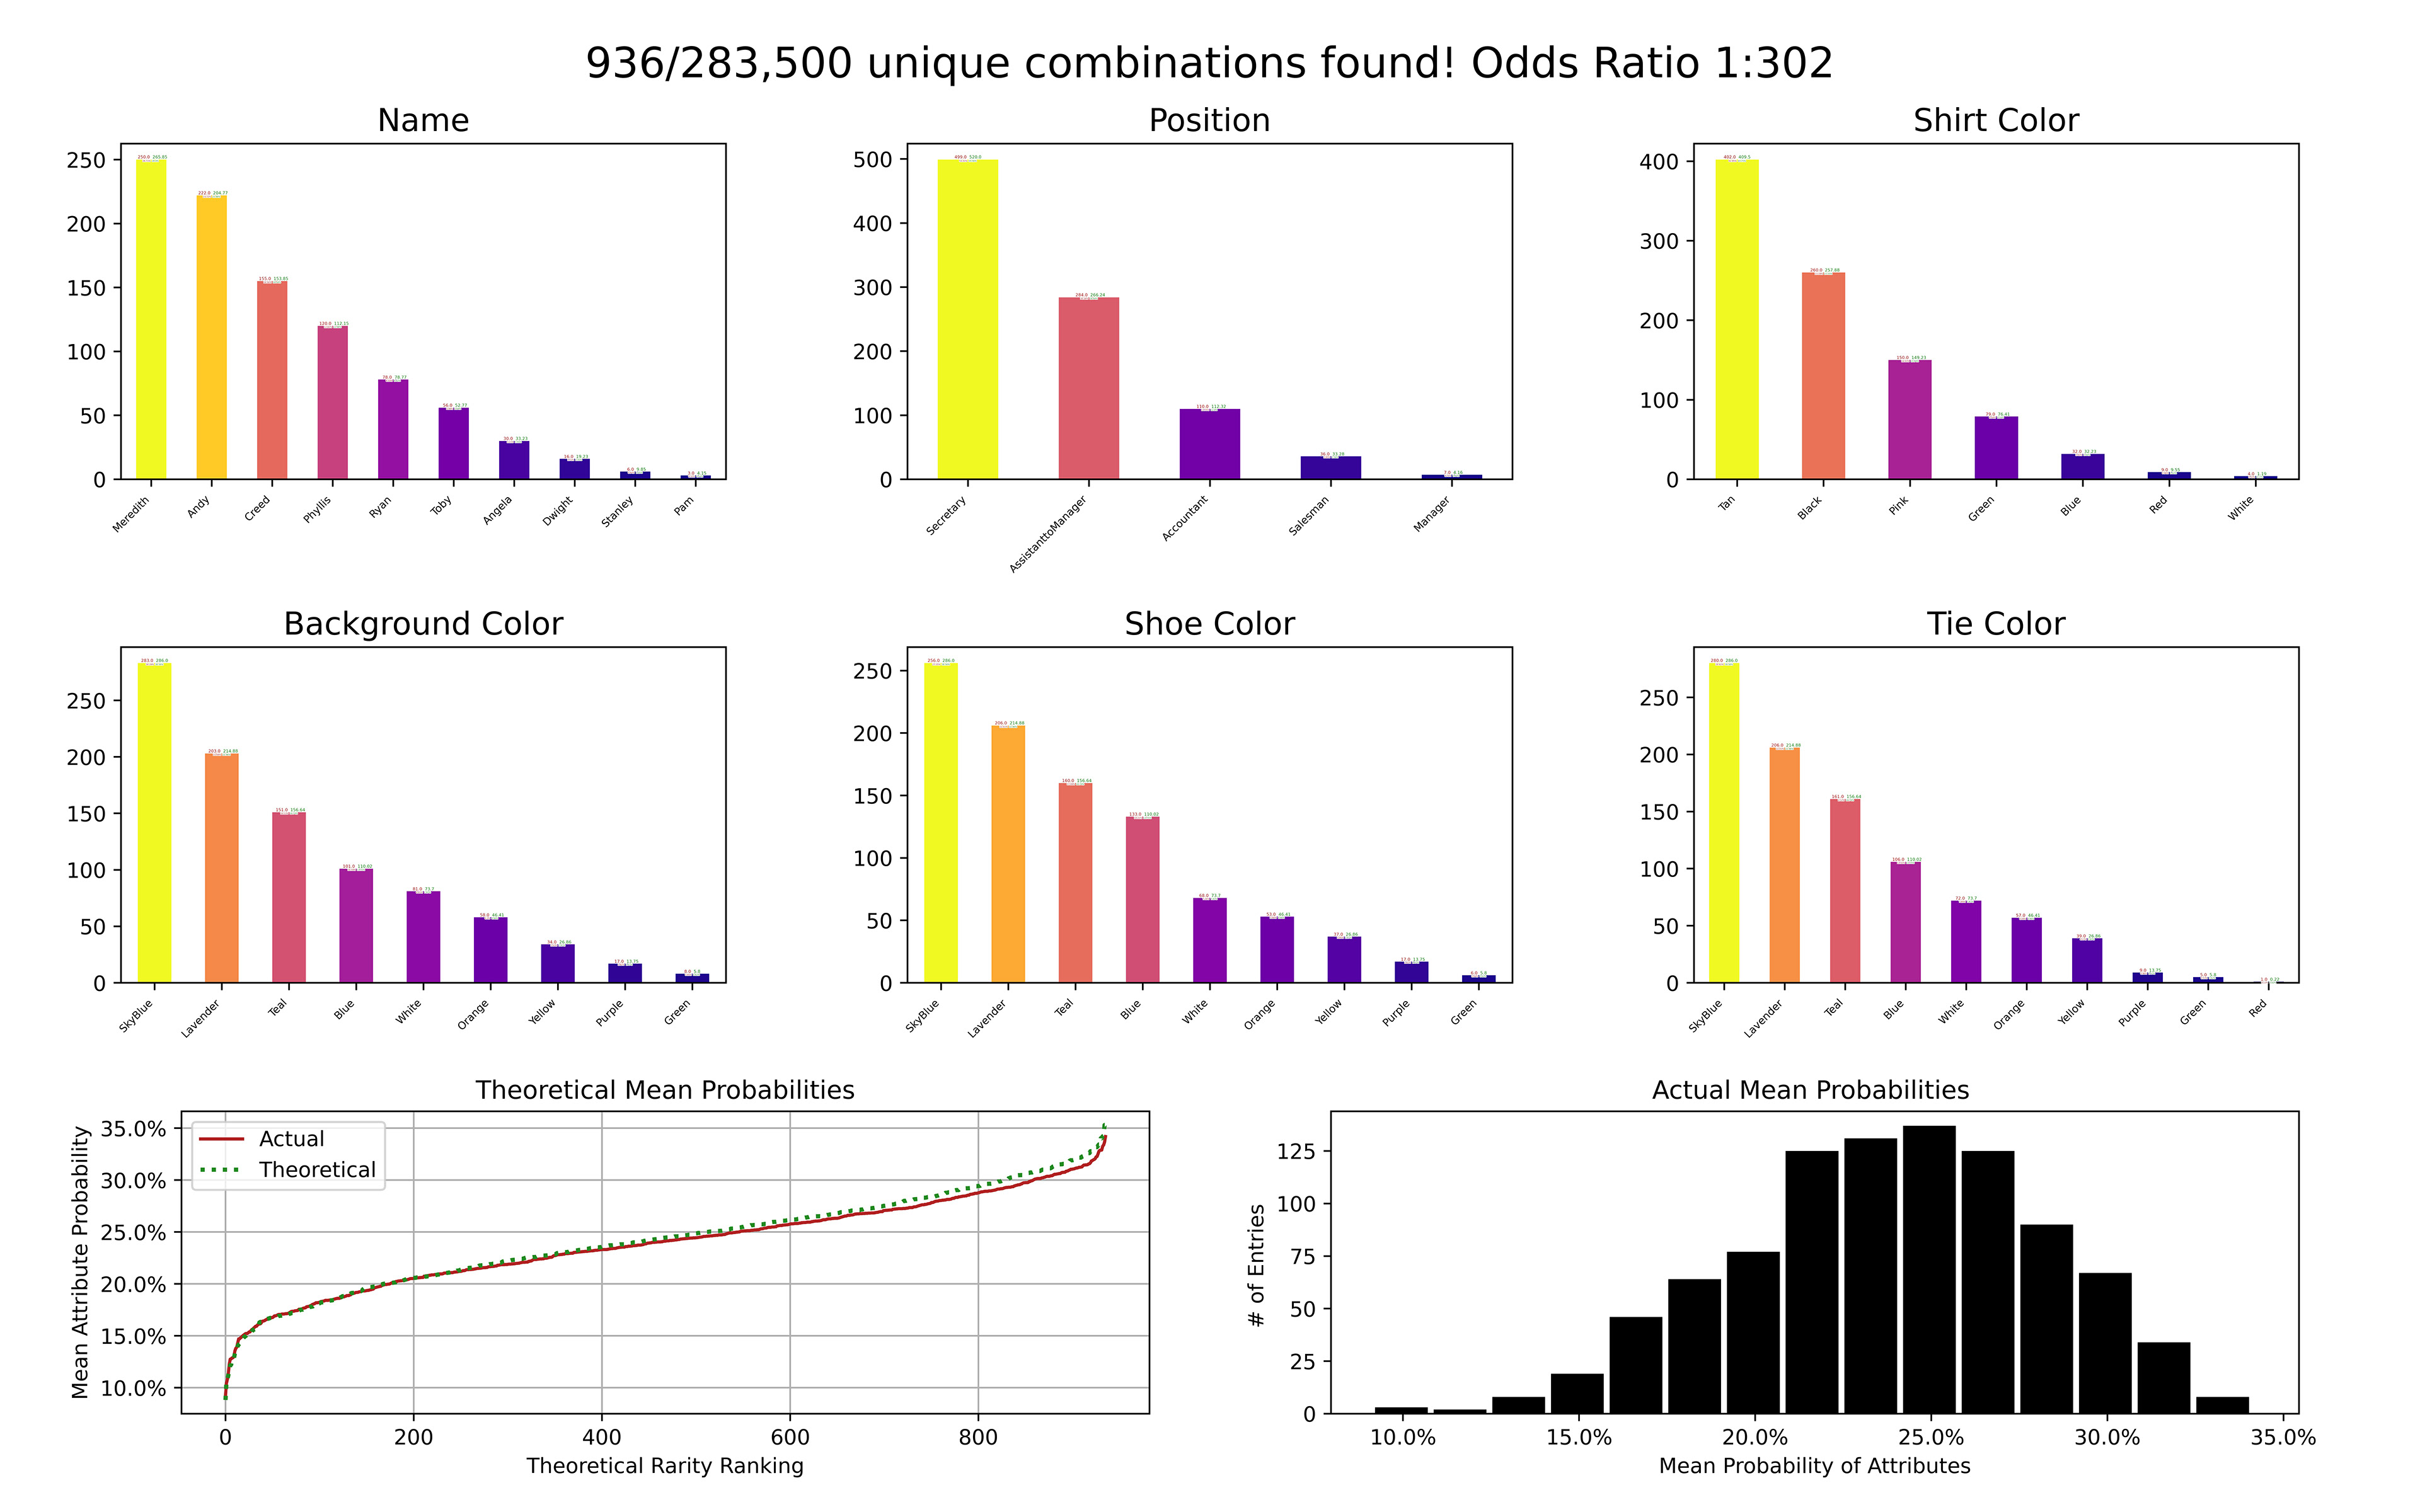
NFTs, or Non-Fungible Tokens, are a recent technology that have been gaining significant traction in the public eye. Generally speaking, each NFT is unique, and they are often digital images. Each digital image within a collection has attributes that make it unique. Some attributes are more rare & desirable, while others are common.
The above plot shows the distribution of each attribute provided by the user. Take a look at just the 'Shirt Color' plot in the upper right. A Tan shirt is the most common attribute, while a White shirt is extremely rare. These distributions were randomly generated using Pandas & Numpy python libraries, and plotted using Matplotlib.
What is the utility?
For right now, it helps NFT creators better understand how many attributes they will need for their project. It makes it easy to visualize how each attribute will be used in the final collection, which in turn allows for better projects & happier customers.
The next iteration of this project will actually allow users to download the data. A dataframe containing the resulting NFTs and each of their attributes will be available in a variety of formats.