This is a continuation of an original project here, take a look there for a better overview of how this works. Generally, I use a google form to enter data anytime I earn or spend money. Those transactions are categorized, logged, and can be analyzed using a linked google sheet.
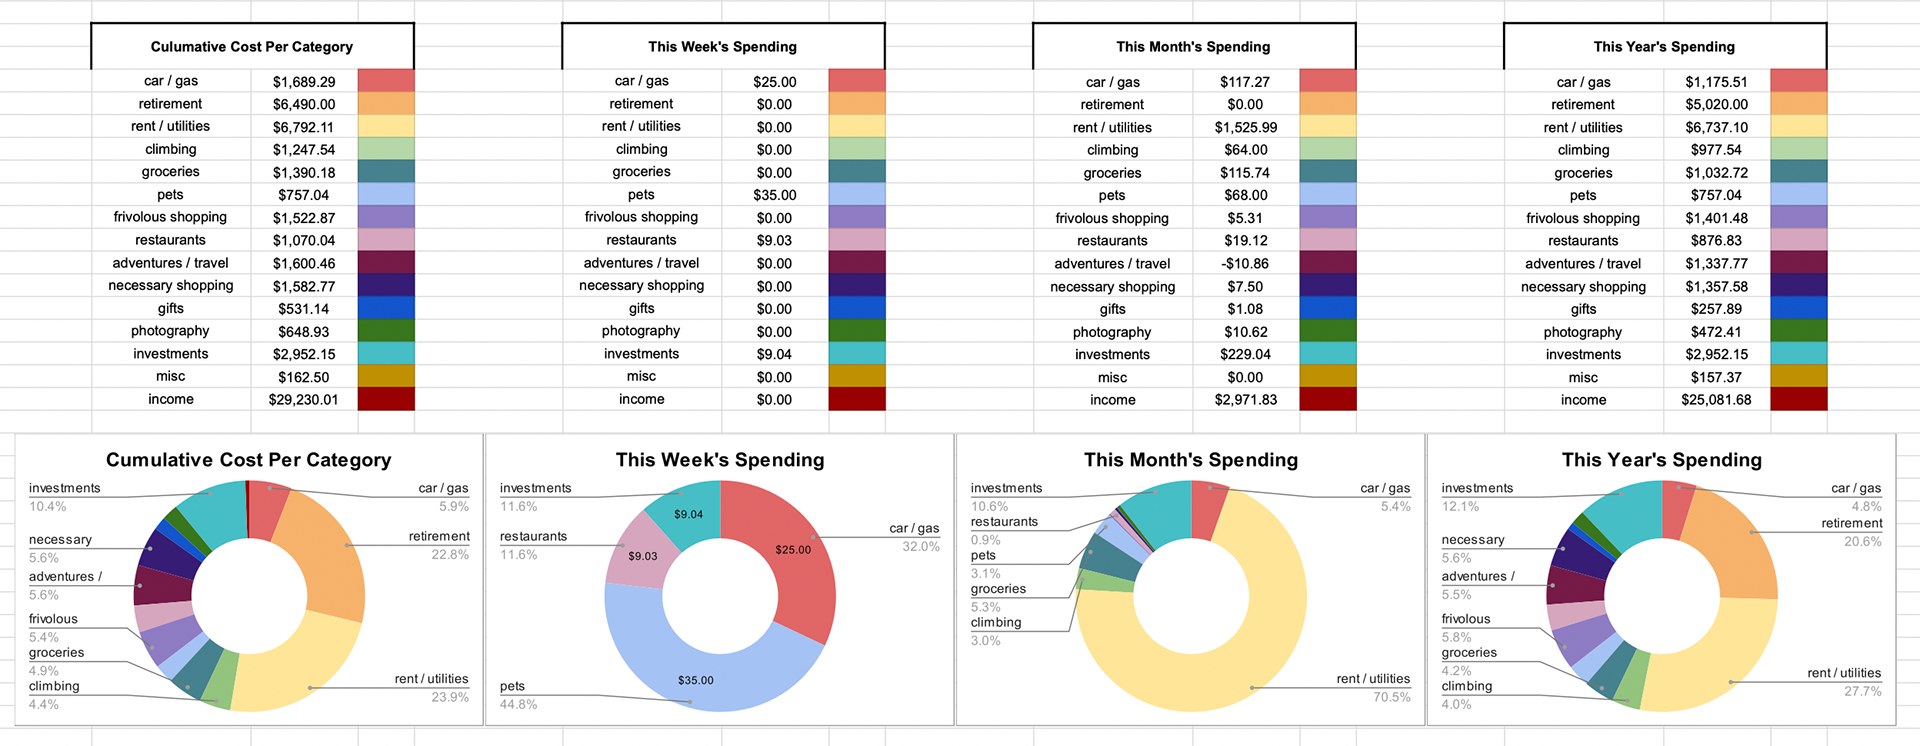
The above image shows a sample dashboard with some dummy data. The data is color coded, broken down into different timeframes, and allows the user to easily visualize where their money is going!
The next iteration of this project will be entirely Python-based. Below, you'll find a sample work in progress dashboard of this! It will be fully interactive, allowing the user to toggle different categories on & off, filter transactions by date range, amount, and hopefully more! This is all done using Python's Matplotlib, Pandas, and Numpy libraries.